
How downtime, quality failures, and emergency spends erase savings
Imagine This
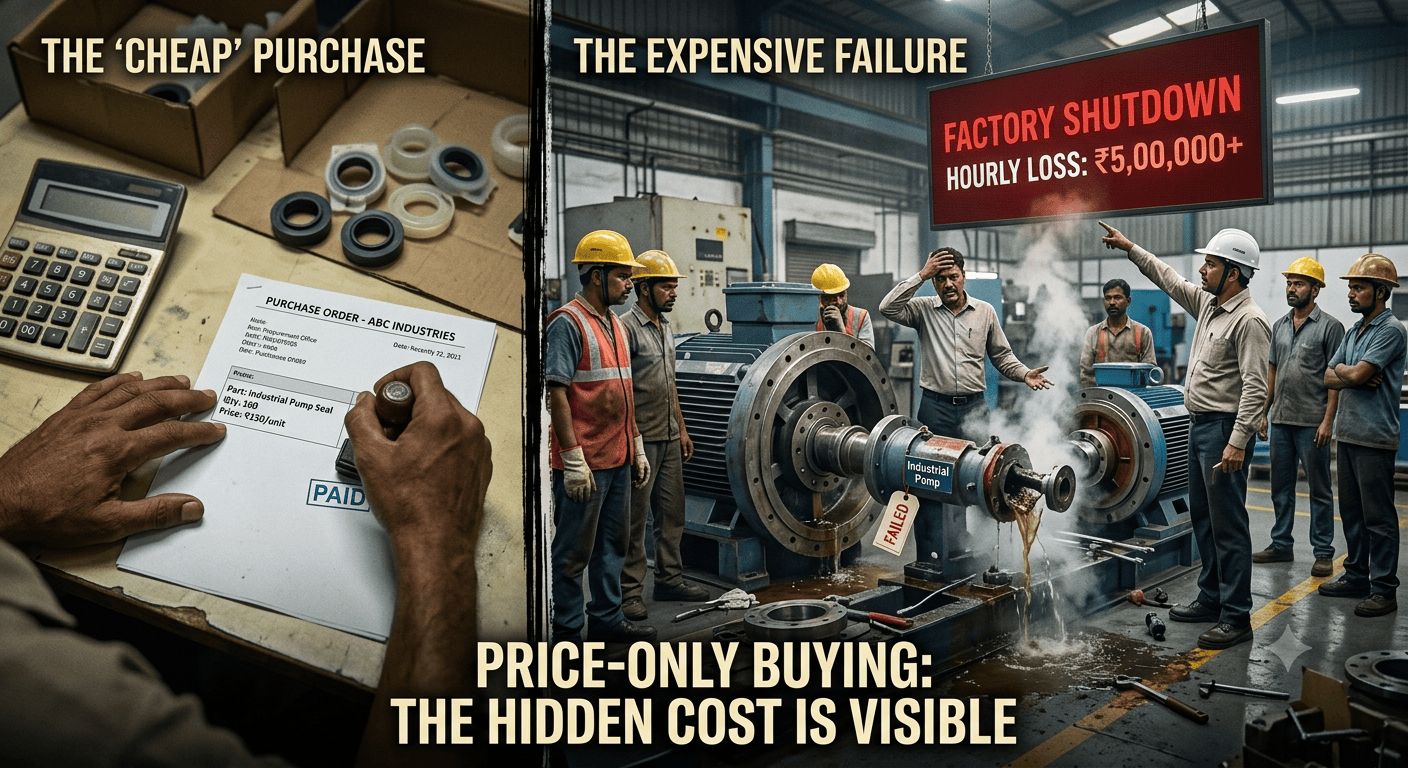
They sold the cheapest pumps. But three months later the factory stopped for a day, then two days, then a week. The culprit? A cheap valve whose threads stripped under steam — a simple failure that cascaded into lost production, expedited freight, angry customers, and an emergency purchase that cost twice the original saving.
Price looks good on an invoice. It rarely looks that good on a balance sheet when things go wrong. Yet procurement teams still chase cost-per-unit like it’s the only KPI that matters. That’s the problem this blog tries to fix.
Why focusing only on price is a false economy, what procurement usually misses, and — most importantly — how a TCO mindset saves money, hassle, and reputation. Read on if you run a plant, sign the POs, or sit in monthly review meetings where "cost down" is the headline.
The problem in one line
Price is immediate and visible. Total Cost of Ownership (TCO) is delayed and hidden. Humans and organisations prefer the visible saving. That bias creates dangerous procurement choices.
Why price wins emotionally
- Quick wins: A lower PO price shows immediate results in month‑end dashboards.
- Simplicity: Price is a single number; TCO needs data, judgment, stakeholder collaboration.
- Incentives: Buyers are rewarded (bonuses, recognition) for reducing invoice amounts.
Why those wins are often losses
- Hidden costs compound: downtime, quality failures, rework, expedited logistics, warranty claims, higher inventory, and supplier switching costs.
- Risk exposure: Single-sourced cheap suppliers can fail quality or delivery, increasing disruption risk.
- Opportunity cost: Poor part performance reduces machine uptime, throughput, and thus lost sales and customer goodwill.
A practical framework: From Price to TCO in 5 steps
Use this as a checklist for procurement reviews, supplier selection, and contract renewals.
Map cost buckets (start with the obvious)
- Direct price: unit cost, freight, taxes.
- Quality costs: scrap, rework, returns, field failures, warranty.
- Reliability costs: downtime per failure, Mean Time Between Failures (MTBF), maintenance labor.
- Speed costs: expedited freight, premium labor for fixes, stockouts.
- Lifecycle costs: replacement cycles, energy consumption, disposal/scrap.
- Administrative costs: inspection time, repeated approvals, supplier audits.
Estimate each bucket in ₹/year or ₹/part for apples-to-apples comparison.
Convert failures to money (the uncomfortable math)
Quantify a plausible failure scenario: e.g., a 1% failure rate for a valve used in 100,000 cycles a year that causes 4 hours average downtime.
Translate into:
- Lost production value per hour,
- Labour overtime or contract engineering for emergency fixes,
- Replacement part and freight premium. Even rough numbers beat hand-waving — management understands rupees.
Use risk-weighting, not wishful thinking
Probability × impact = expected cost. Don’t ignore low-probability high-impact events. For critical equipment, treat supplier failure much like an insurance premium: pay more now or pay more later in a crisis.
Ask the right supplier questions
Beyond “what’s your best price?” ask:
- What’s your defect rate and service response time?
- Can you commit to lead times and buyback/return policies?
- Do you provide process documentation, spares, and on-site support?
- What’s your RM sourcing traceability and contingency plan?
If answers are vague, price is hiding risk.
Redesign contracts to align incentives
- Penalty for late deliveries, bonus for exceeding uptime targets.
- Long-term price with quality SLAs and periodic reviews.
- Vendor-managed inventory or consignment for critical spares.
These shift focus from one-off lowest price to shared ownership of performance.
Three real-life scenarios
Scenario A — The “cheap fasteners” trap
A plant buys cheaper bolts without traceability. Two months later, a critical assembly has leaks. Investigation shows improper heat treatment.
Result: line shut for 12 hours, rework cost ₹2.2 lakh, expedited new parts ₹60k. TCO: the initial 20% saving vanished.
Scenario B — The “just-in-time, just-in-case” play
Another plant saves on inventory by buying lower-cost bearings with longer lead times. When a bearing fails, lead time = 10 days; production idle for 8 days. The “inventory saving” ends up costing much more than the saving.
Scenario C — The “service matters” win
A compressor supplier charges 8% more but guarantees 24‑hour on-site service, spares pool, and preventive checks. Over the year, downtime for compressors drops by 60%, increasing throughput and saving more than the premium. Net TCO is lower.
How to get your team to think TCO (practical steps you can start this week)
- Make TCO visible in POs: Require a simple TCO worksheet for all purchases over a threshold (say ₹50k).
- Add a “criticality” column in the vendor master: critical, important, commodity. Treat critical differently.
- Change KPIs: reward uptime, on-time delivery, and quality rather than just lowest purchase price.
- Pilot project: run TCO comparison for three categories — fasteners, bearings, and valves — and present results in the next management meeting.
- Train buyers: 2-hour workshop on failure cost math and simple reliability concepts like MTBF/MTTR.
Tools and templates (minimal tech, high impact)
- One-sheet TCO template: list price, freight, predicted failure cost, expected downtime cost, admin cost, net TCO per year.
- Failure-cost calculator: a simple Excel — inputs: failure rate, downtime per event, value per hour, replacement cost, expedited freight multiplier. Outputs expected annual cost.
- Supplier scorecard: quality, delivery, service, price, TCO estimate — color coded for quick decisions.
How CXOs should intervene (not micromanage)
- Set direction: mandate TCO use for critical purchases and major suppliers.
- Sponsor pilots: allocate a small budget to analyze and cover transition costs.
- Align bonuses: include process uptime and supplier performance in buyer compensation.
- Invest in reliability engineering: small plants benefit hugely from a part-time reliability consultant.
Objections you’ll hear — and how to answer them
- “TCO is too slow for our pace.” Response: Start with critical categories; use rough estimates to make better decisions now.
- “Suppliers won’t agree to SLAs.” Response: Most will for a fair price. If not, that’s informative — they’re not ready to be strategic partners.
- “This is just more paperwork.” Response: Replace reactive firefighting with a one-time small effort that reduces repeat crises. Managers prefer fewer fires.
A short checklist for your next procurement meeting
- Is this item critical to uptime or product quality?
- Have we estimated failure and downtime costs?
- Does the supplier provide service, spares, and traceability?
- Can we prototype a higher-spec part and measure the delta in uptime?
- Have we built contingency (secondary supplier or safety stock) for high-risk items?
Final thoughts
Price is a seductive number. It gives fast dopamine — a low invoice, a happy quarterly report. But manufacturing runs on time, quality, and predictability. TCO puts those long-run realities back on the table. For owners and CXOs of MSME Indian manufacturers, adopting a TCO mindset isn’t just “best practice.” It’s the difference between buying cheap parts and buying peace of mind.
Want a ready-to-use TCO template and failure-cost Excel for your next procurement review? Tell me which are your next high impact procurement decisions, (e.g., Machines, packing material suppliers) and I’ll work with you to create tailored templates and a short walkthrough you can use in your next meeting. Reach out to me at phoenix.advizory@gmail.com or +91-9967093949.